Summary
This objective of this study was to develop predictive models for HDB resale prices by fitting transaction records augmented with geospatial data on various statistical learning models and assessing variable importance. Ensemble methods such as gradient boosting machines (GBMs), bagged trees and random forest had the best predictive ability, while neural networks had the lowest predictive ability. In terms of the relative importance of resale price determinants, the study found that housing characteristics like floor area and remaining lease were more important than most locational factors except for the distance to CBD and the nearest MRT station.
Introduction
The vast majority of Singaporean households live in public housing apartments built by the Housing Development Board (HDB). These flats are built in different configurations of relatively homogenous layouts across Singapore and can be sold on an open market after a five-year minimum occupation period (HDB 2018). Housing prices are often modelled by hedonic modelling, which considers a building as a “bundle of goods” encompassing its physical and locational characteristics (Monson 2009), the value of which determine housing prices. HDB resale flats are prime subjects of such hedonic analysis since the consistency in structure quality across neighbourhoods helps to distinguish price changes due to unit-specific and locational determinants (Xu 2017).
Using HDB resale transactions in 2019 augmented with geospatial data, this study explores two main objectives: first, to predict HDB resale prices by fitting various statistical learning models; second, to infer the relative importance of predictors from these models. The outcome of the study could help potential resale flat buyers and sellers navigate the pricing market.The next section describes the datasets, statistical learning models and metrics used. Section 3 summarises the results, and Section 4 discusses the possible implications of this study before Section 5 concludes the report.
Methodology
Dataset
The dataset was sourced from the government’s open data portal. It contains data for all HDB resale flat transactions in 2019 with a total of 22,189 entries (HDB 2020). Each entry includes information on the nominal transaction price, the town where the flat is situated, the flat layout and model, address, storey, floor area and length of lease remaining. The dataset was then geocoded based on the addresses using the OneMap API (SLA 2018), and the geodesic distance from the flats to the Central Business District (CBD) and nearby amenities (e.g. nearest train station, hawker centre) was computed. The dataset did not contain missing values. A summary of all relevant variables is included below.
| Name | Description |
|---|---|
| Resale Price | Nominal price of transaction |
| Remaining Lease | Length of remaining lease in years |
| Floor area | Floor area in m2 |
| Storey | Storey of unit |
| Town | Town in which flat was located |
| Flat model | Model of flat (e.g. new generation) |
| Flat type | Number of rooms in flat (e.g. 3-room) |
| Distance to CBD | Geodesic distance from unit to CBD in m |
| Minimum distance (mall) | Geodesic distance to nearest shopping mall in m |
| Minimum distance (public hospital) | Geodesic distance to nearest public hospital in m |
| Minimum distance (MRT station) | Geodesic distance to nearest MRT station in m |
| Minimum distance (primary school) | Geodesic distance to nearest top 25 primary school in m |
| Minimum distance (fire station) | Geodesic distance to nearest fire station in m |
| Minimum distance (police station) | Geodesic distance to nearest Singapore Police Force establishment in m |
| Minimum distance (waste treatment facility) | Geodesic distance to nearest toxic industrial wastes treatment and disposal facility in m |
| Minimum distance (park) | Geodesic distance to nearest park in m |
| Minimum distance (community club) | Geodesic distance to nearest community club in m |
| Minimum distance (public library) | Geodesic distance to nearest public library in m |
| Minimum distance (exercise facility) | Geodesic distance to nearest public exercise facility in m |
| Minimum distance (hawker centre) | Geodesic distance to nearest hawker centre in m |
Pre-Processing
The Variance Influence Factor (VIF) and the correlation matrix showed that some groups of variables were correlated with each other. If left unresolved, multicollinearity may cause misleading results about variable importance (Paul 2006). In particular, town was correlated with the distance to the CBD, and flat type was correlated with floor area. This was expected since both sets of variables provide similar information. A conscious decision was made to drop the town, flat type, and model variables to improve model conciseness and interpretability. All remaining variables had a VIF between 1 to 3, which indicated that multicollinearity was largely reduced. No further feature selection was conducted since variable importance measures would reveal insignificant features. Prior to model fitting, all predictor variables were centred and scaled to aid comparisons across different units.
Models
The dataset was randomly split into a training and test set with a 3:1 ratio. All models were fit and tuned using 4-fold cross validation on the training set and evaluated on the test set.
Multivariate Adaptive Regression Splines (MARS)
MARS is a non-parametric regression technique that extends linear models by modelling nonlinearities and interactions between variables through the weighted sum of basis functions. It is more flexible than linear regression and does automatic variable selection. However, the variable selection can sometimes be arbitrary when the predictors are correlated. To address this, the MARS models were bootstrapped aggregated. MARS models have a specific variable importance metric that tracks the reduction in generalized cross-validation estimate of error as each predictor is removed during the backwards elimination feature.
Gradient Boosting Machine (GBM)
GBMs build an ensemble of individual decision trees by iteratively increasing the weight of trees with high errors. This method boasts strong accuracy and flexibility, although it is computationally expensive. GBMs have a specific variable importance metric. This calculates the MSE for each tree on the out-of-bag (OOB) portion of the data after permuting each predictor variable. The differences are averaged and normalised by the standard error. Summing the importance values over each boosting iteration returns the overall variable importance (Kuhn 2019).
Tree Bagging, Random Forest
Decision tree bagging and random forests are tree ensemble methods similar to the GBM, except they weigh all trees equally. Random forests extend bagging by only taking a random subset of predictors to fit the trees. These methods also have the same variable importance measure as GBMs, calculated by the average increase in squared OOB residuals when the variable is permuted (Grömping 2009).
Neural Network
Basic feedforward neural networks were also chosen to model the resale prices. Neural networks are flexible but come at a cost of high variance as they learn via stochastic training algorithms. This makes them sensitive to changes in the training data which affects the weight calibration each time they are trained, leading to different predictions. To reduce the variance of the model, bagging was also applied to develop a model averaged neural network. Unlike the preceding methods, neural networks do not have a model-specific measure of variable importance. As such, relative importance is evaluated by the
Metrics
The metrics for the objective of predicting resale prices are the Root Mean Squared Error (RMSE) and R2 on the test set. These are commonly used metrics for regression problems and reflect the quality of fit and predictive ability of each model.
The metric for evaluating relative variable importance is less straightforward since it is measured on different scales between models and is therefore difficult to compare. For this study I proposed two possible solutions: first, a rank-based system that averages the rank of each predictor’s relative importance across all models; and second, a proportion-based score system that averaging the standardised relative importance across all models. The first method highlights the order of relative importance, while the second is a rough (albeit non-rigorous) estimate of the extent of relative importance.
Results
The optimal hyperparameters from model tuning are summarised below.
| Model | Tuned Hyperparameters |
|---|---|
| MARS | nprune = 34, degree = 2 |
| Bagged MARS | nprune = 100 and degree = 2 |
| GBM | n.trees = 5000, interaction.depth = 5, shrinkage = 0.05, n.minobsinnode = 3 |
| Bagged Trees | mtry = 16 |
| Random Forest | mtry = 6 |
| Neural Network | size = 5, decay = 0.01 |
| Model Averaged NN | size = 3, decay = 0.1, bag = TRUE |
Prediction
| Model | RMSE | |
|---|---|---|
| MARS | 47200 | 0.902 |
| Bagged MARS | 45200 | 0.910 |
| GBM | 32800 | 0.953 |
| Bagged Trees | 19300 | 0.984 |
| Random Forest | 19500 | 0.984 |
| Neural Network | 135000 | 0.446 |
| Model Averaged NN | 114000 | 0.489 |
The performance of the models is summarised in above. In general, bagged models (MARS and Model Averaged NN) improved over their singular counterparts, suggesting that the reduction in variance has aided predictive ability. Bagged trees and random forest performed the best out of all the models, with bagging slightly outperforming random forest. Neural networks were found to have high errors, which was only slightly improved during bagging. Due to their low quality of model fit, neural networks were excluded in the variable importance computation.
Variable Importance
| Variable | Rank | Score |
|---|---|---|
| Floor area ( |
1 | 31.51 |
| Distance to CBD | 2 | 19.03 |
| Remaining lease | 3 | 12.71 |
| Minimum distance to nearest MRT station | 4 | 6.41 |
| Storey | 4 | 6.01 |
| Minimum distance to nearest mall | 6 | 5 |
| Minimum distance to nearest hospital | 6 | 3.71 |
| Minimum distance to nearest public library | 6 | 2.09 |
| Minimum distance to nearest public gym | 9 | 1.89 |
| Minimum distance to nearest fire station | 9 | 1.56 |
| Minimum distance to nearest park | 11 | 2.39 |
| Minimum distance to nearest primary school | 11 | 1.56 |
| Minimum distance to nearest community centre | 11 | 1.63 |
| Minimum distance to nearest waste treatment plant | 14 | 1.49 |
| Minimum distance to nearest police station | 14 | 1.78 |
| Minimum distance to nearest hawker centre | 15 | 1.21 |
The relative importance ranks and scores were computed on the bagged MARS, GBM, and random forest models and are shown in the tables above. While the bagged trees outperformed the random forest in terms of RMSE, the random forest model was selected due to the lower possibility of correlated trees and dominant predictors that are otherwise unimportant (Auret and Aldrich 2011). The results were generally consistent for the 6 most important variables, which suggested that housing characteristics were more important than most locational characteristics in determining HDB resale prices, with the exception of the distance to CBD and the nearest MRT station.
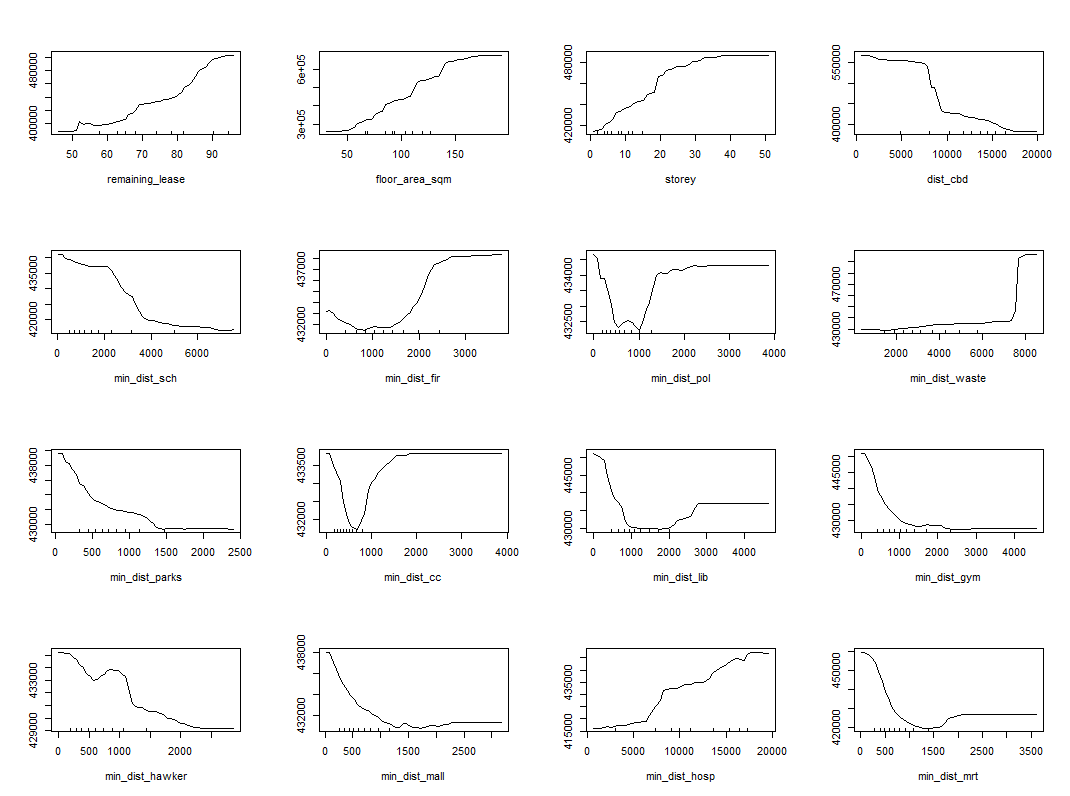
It should be noted that the variable importance rank and score vary slightly for less important factors, which suggest some underlying flaws in the score computation even if the predictors remain in the same tier of importance. Nonetheless, the models provided some idea of the order and extent of relative importance. Further information on the direction of influence by each predictor is represented in the partial dependence plots below.
Discussion
The models highlighted in this study were chosen because most of them had specific variable importance measures. Furthermore, the models generally high predictive abilities. Ensemble models performed well since they have high flexibility in representing hypotheses not necessarily contained in the hypothesis space of the models from which they were built (Anderson 2019). Neural networks were not expected to fare poorly, since they are known to be flexible, low bias methods. Model averaging only served to reduce the variance and not bias. A possible explanation for their high bias is that the model was underfitting or the optimal hyperparameters were outside the tune grid. This can be corrected by increasing the scope of the grid search, possibly reducing underfitting that led to high bias.
The results showed that of all predictors considered, housing characteristics like floor area and remaining lease were more important than most locational factors. This suggests that housing characteristics relate more directly to the value of the property, while amenities such as parks and hawker centres, which are commonly found across Singapore and are thus not unique, are valued less. A limitation of this method is that it considers amenities as homogeneous in value, when in reality there may be a higher premium for flats near for example an MRT interchange than less accessible station. These nuances are not captured in this study but may be considered in future studies.
This study can be also extended by including additional parameters such as time of transaction which may provide additional information about HDB resale price determinants. However, collinearity is still an issue that needs to be checked when introducing new variables. Additionally, given more resources, models like the neural networks can be tuned more effectively or more models can be fit. For instance, generalised linear models lend themselves to more direct interpretation of the extent and direction of variable importance by the estimated
Conclusion
This study sought to develop predictive models for HDB resale prices by fitting transaction records augmented with geospatial data on various statistical learning models and assessing variable importance. Ensemble methods such as GBMs, bagged trees and random forest had the best predictive ability, while neural networks had the lowest predictive ability. In terms of the relative importance of resale price determinants, the study concluded that housing characteristics like floor area and remaining lease were more important than most locational factors except for the distance to CBD and the nearest MRT station.